I’m pleased to provide a guest post from Ryan Sullivan. Ryan began his career as an engineer, and recently started his own financial advisory practice. In my conversations with him, I was impressed with his knowledge of investing and his desire to try to help his clients outperform. Many financial planners spend all of their time prospecting for new business, treat investing like a side annoyance, and just put client funds into indexes or so many mutual funds that they effectively own the indexes.
Ryan spends a lot of time focusing on the investing side of the business. That means he’s running a boutique firm, and providing high-level value-added services to his clients. Those are the kinds of advisors DKI likes to work with as we’re 100% focused on great performance and think that’s what you deserve.
Here are Ryan’s thoughts on interest rates, inflation, and bonds right now:
Introduction:
Interest rates have been making headlines for the last 18 months—ever since the Federal Reserve first started hiking rates. People are wondering how long the rates are going to keep rising, borrowers are hoping for rates to go back down, and investors are taking real consideration for how rates affect the future of their portfolios.
Since the FED announced they would be hiking rates, the Federal Funds Effective Rate has gone from 0.05% to 5.12%. In percentage terms this is a massive change in policy. Historically though, a 5.12% federal funds rate is just slightly above average.
If you aren’t familiar with the Federal Reserve and how they manipulate interest rates to regulate the economy, here is a quick primer:
1. The Federal Reserve controls the Federal Funds Rate which is the interest rate that banks and credit unions use to lend to other banks.
2. This interest rate sets the benchmark for all other interest rates in the economy. I.E. as the Federal Funds rate increases, other interest rates are likely to follow suit.
3. Interest rates are one of the primary levers used to control the economy and ultimately impact inflation.
4.By increasing the Federal Funds Rate, the FED’s goal is to slow down the economy by increasing the cost of the lending. As lending becomes more expensive, it is harder to get capital, which means people and businesses are less inclined to spend or invest.
5. This reduction in spending leads to less economic growth which in turn should reduce the price of goods and thereby reduce inflation.
It’s counterintuitive to think of slower economic growth as a desirable outcome, but as we have all experienced over the last two years, an economic policy that is too loose can lead to rapid inflation which has its own risks. At the end of the day, interest rates are the primary tool that the government has to help mitigate inflation.
Inflation
Inflation is often and rightfully called the “Invisible Thief”. In June 2022, the 12-month percentage change of the Consumer Price Index (CPI), hit 9.1% which was a 40-year high.
For reference, if prices were to increase at 9.1% every 12-months, it would only take 8 years for your purchasing power to be cut in half (i.e. $100 today could buy you $50 worth of goods in 8 years). For someone trying to save and build wealth, this is a very difficult hurdle to overcome.
Since the 1990’s, the FED’s target rate for inflation has been 2% (an arbitrary number), and they manipulate interest rates in an attempt to maintain that goal. At a 2% inflation rate, every 8 years you have around a 15% reduction in purchasing power. That is significant.
Interest rates generally chase the inflation rate and tend to be cyclical. For example, as inflation rises, the Fed increases interest rates to slow down the economy and reduce inflation. As the economy slows, the FED wants to stimulate the economy so they bring rates down. When rates come down, economic activity increases and typically, so does inflation.
Rates in Perspective
Jumping back to where we are today, the Federal Funds Effective Rate stands at 5.12%. Looking back to 1954 when the FED first started publishing the data on a daily basis, the historical average of the Fed Funds Rate is 4.60%. The median is 4.14%.
That puts today’s rate just ~0.5% above the 70-year average. In that timeframe, the highest that rates reached was over 19% in 1981. For the period of 1979-1984 rates averaged over 12%! From 1995-2000, rates averaged 5.5%.
I mention these examples to show that the FED has a history of sustaining interest rates at a particular level for many years. Expecting rates to jump up and then drop back down doesn’t line up with what we’ve seen historically.
Below is a chart showing the Federal Funds Effective Rate over the last 70 years. As you can see, we are still at low levels relative to historical values.
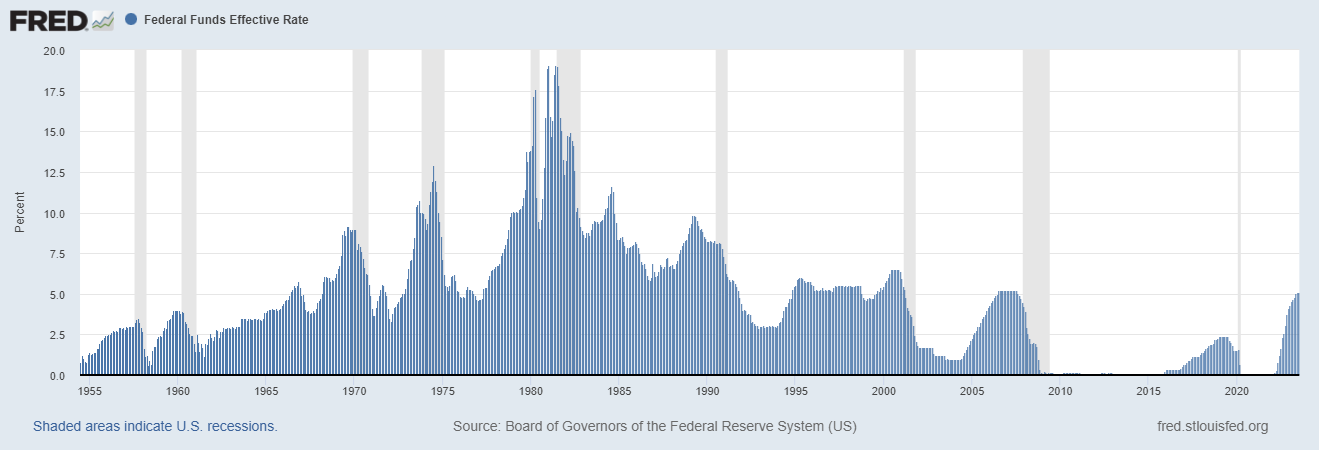
If you look closely at that chart, you will notice that the majority of the last 70 years was spent above 2.5% (68% of the time to be precise). The period from 2009-2022 is really the anomaly in the whole chart. In fact, if you remove that time period, 85% of the time between 1954-2008 was spent with a Federal Funds Effective Rate above 2.5%.
You can also see that rates don’t usually go up and then down right away. It is a process that takes years for a full cycle to play out. The range from 1954 to 2020 illustrates how long these cycles can be. From 1954-1981, rates were generally moving up. From 1981-2020, rates have been trending down.
Bonds
Longer duration bonds are highly sensitive to the Federal Funds Effective Rate. As interest rates increase, existing bonds go down in price (due to being less attractive than newer bonds issued at a higher rate).
This next chart shows the US Government Bond 10-year rate, sometimes referred to as the “Chart of Truth”. This chart shows that for the last 40 years there has been a very prominent channel with clear tops and bottoms as well as an overall downward trend in yields. In 2022, this channel was broken as rates accelerated up and broke this 40-year pattern.
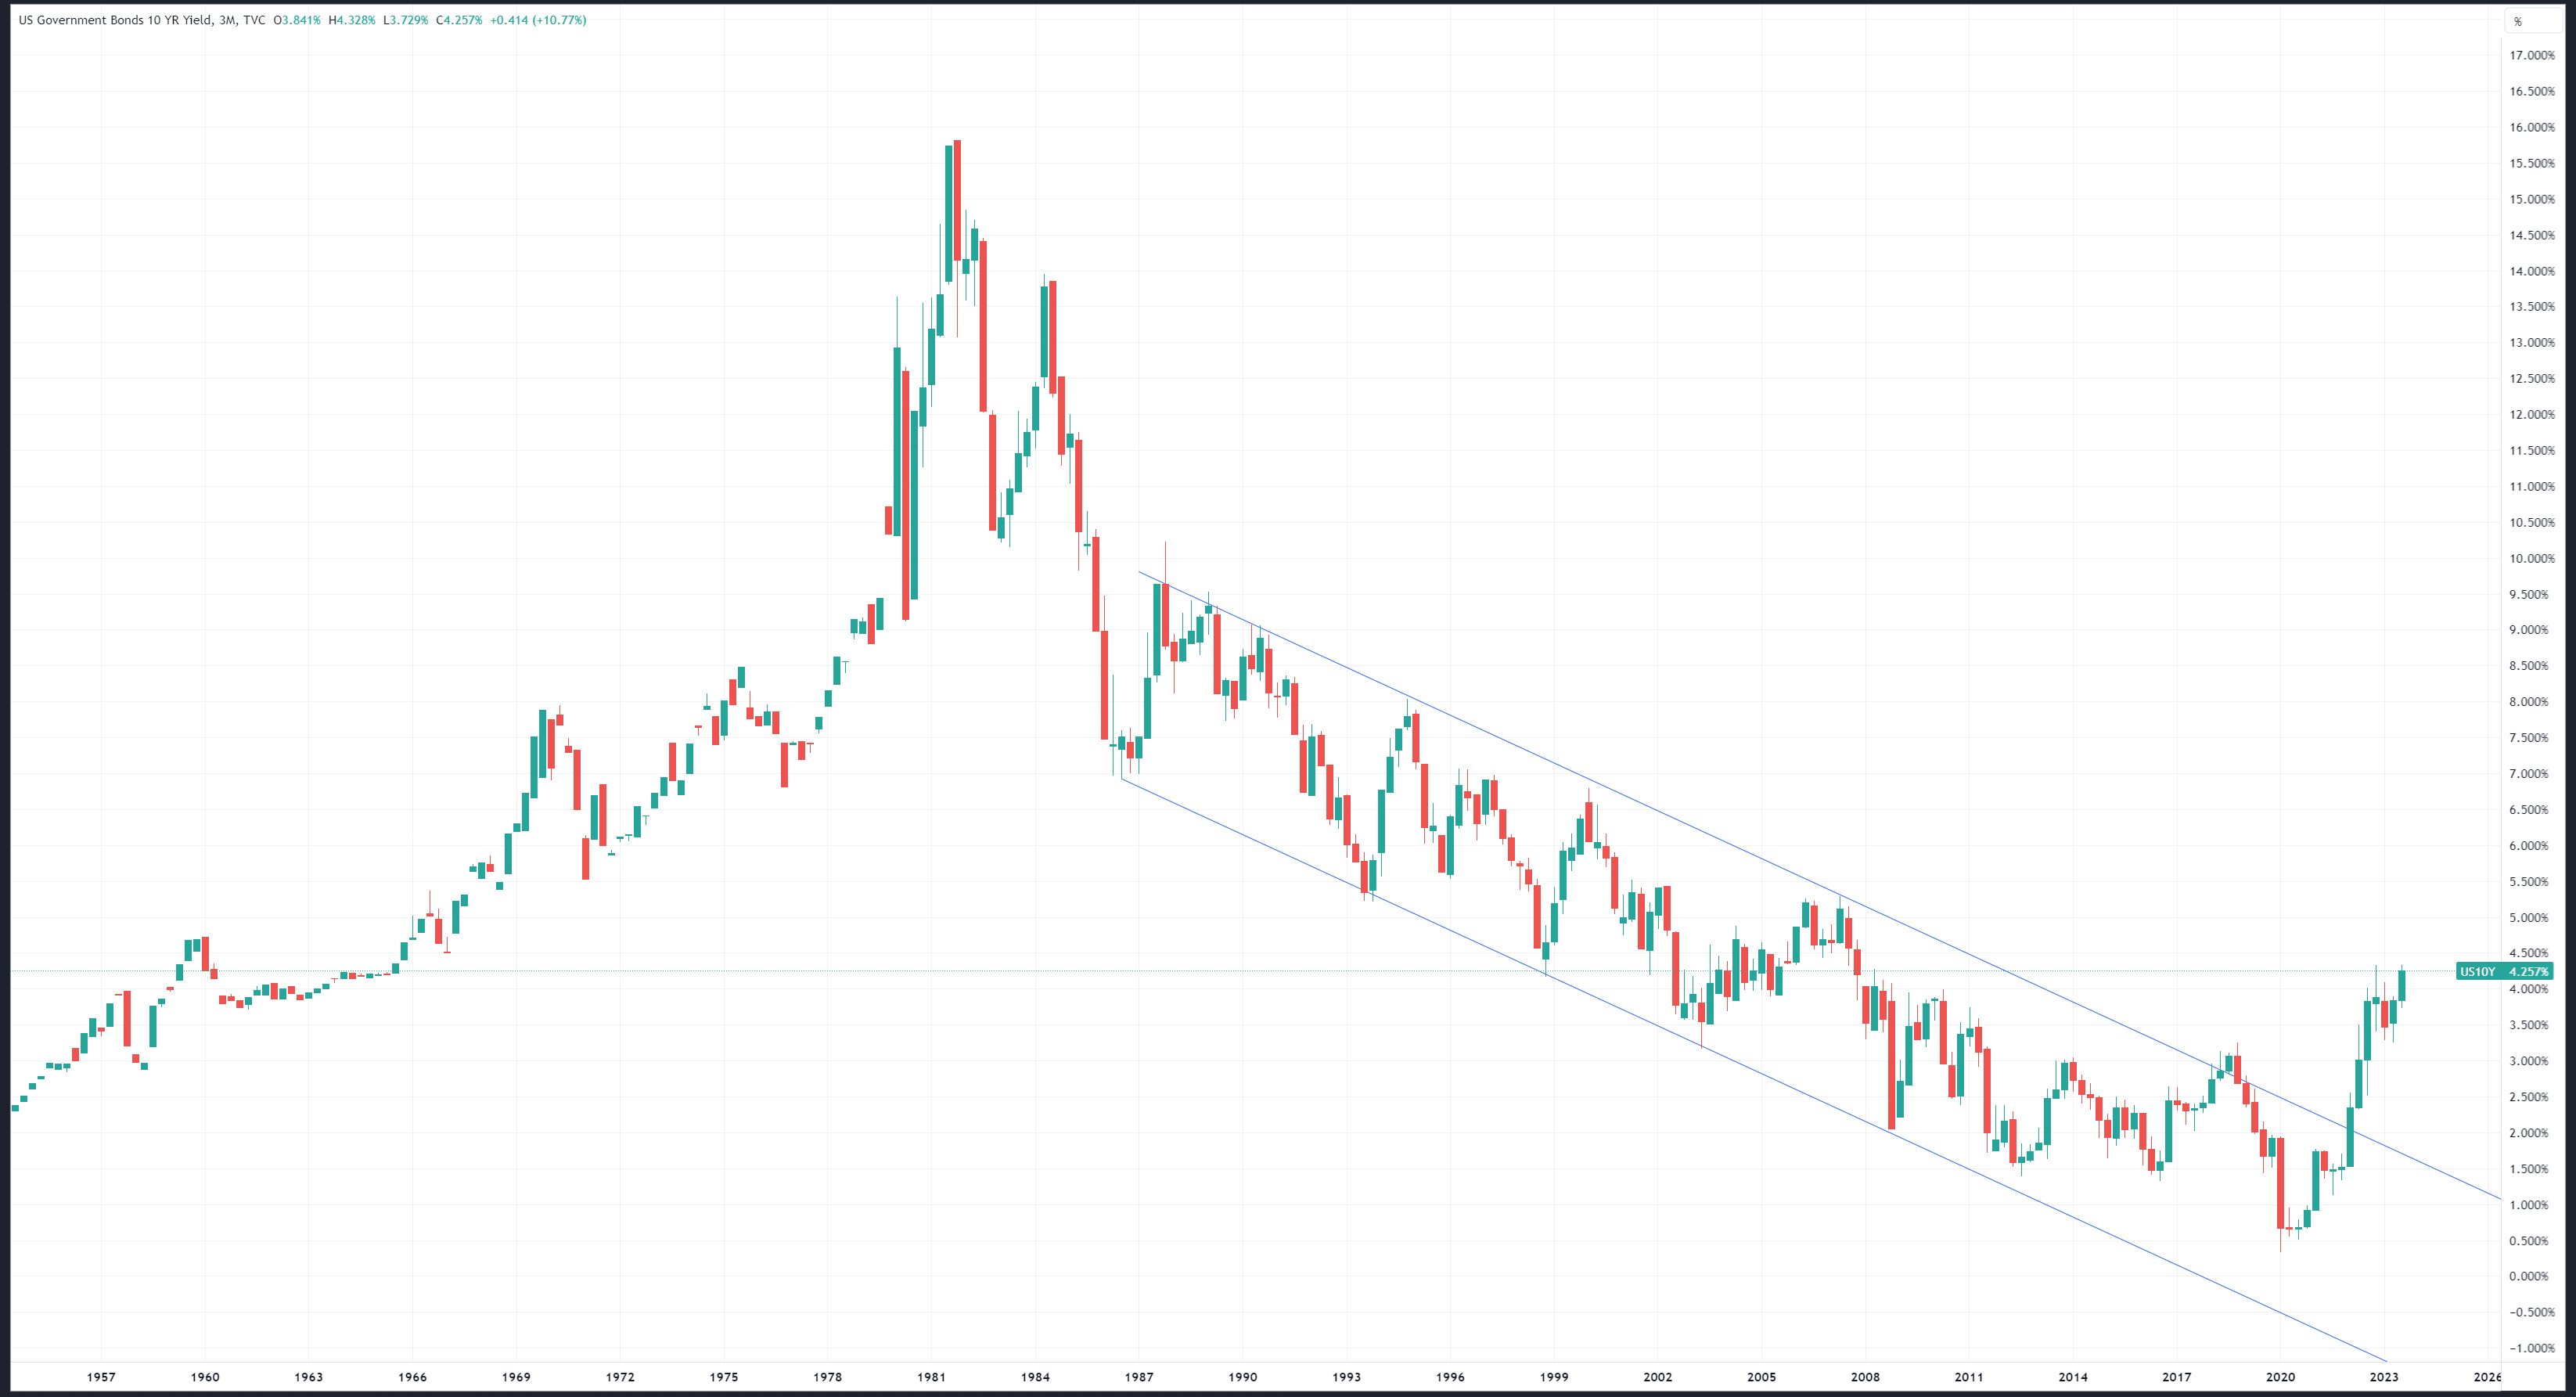
So, the question becomes, what now?
Analyzing the probabilities of likely outcomes can give us some insight into what we can expect in the future. Summarizing the current situation, we get the following:
- Over the last 14 years, interest rates have been historically low
- In the last year we have broken a major 40-year trend in declining rates
- The FED has repeatedly indicated that they want to maintain higher interest rates
With higher rates, there are a couple things to consider. First, make sure that you are utilizing the higher savings and interest rates that banks, money markets, and short-term bonds are paying. These rates range from 4-5.5%. Cash is no longer trash.
When evaluating an investment, it is important to factor in the “risk premium” or what you are being paid to take on risk. With the relatively high “risk free” returns on these low volatility investments, in order to justify more risky investments such as stocks, you better be sure that you have the opportunity to make more than 4-5% returns.
Another factor to consider is that for the traditional portfolio allocation of 60/40 (stocks/bonds), bonds may not perform like they have in the past as they will be constantly fighting the headwind of a rising interest rate environment.
Predicting the Future
Long-term, it seems that we have entered into a new era of rising interest rates (see 1954-1981). For a classic 60/40 portfolio holder, bonds might not work like they have in the past. This means that asset allocators are going to have to get more creative with how they protect a portfolio.
On a medium time horizon, there is likely to be significant interest rate volatility as the market struggles with this new direction. Interest rates are also closely connected to economic growth, so they are likely to move with the business cycle. Understanding where we stand in the business cycle can help inform where rates might go next. Using bonds as a tactical allocation at these times can provide a nice return.
On a short time horizon, it is hard to say what the exact top will be. We just hit the prior highs in the 10-year yield from October 2022. How much more can the economy take before the rate increases bring economic activity crashing down? There’s no way to know for sure, but as of now markets are still posting positive gains. Pay close attention to rates so you can be on top of where the broader market might go.
Wrap Up
Interest rates are still rising and, while people have been calling for the top in rates for a while now, they continue to rise. At a certain point we might just have to accept that the economy is strong. Maybe we can handle higher rates? Until we can’t. There is no doubt in my mind that governments, businesses, and people are going to struggle with these higher rates. The question instead is when do the effects become apparent? It takes a while for the full effects of rate hikes to really be felt.
To me this feels like a 2024 story.
Author: Ryan Sullivan, PE
After successfully building an engineering department from the ground up to over $1M in annual revenue in under 5 years, Ryan founded Off the Beaten Path Financial in pursuit of his passion for finance, investing, and the perfect spreadsheet.
Now he provides comprehensive financial planning, cash flow management, and investment management to guide architects and engineers along the path to financial freedom.