For the past few years, we’ve all heard that Bitcoin is just a high-beta proxy for the NASDAQ. It seemed to make sense, but what does the data say? We look at whether Bitcoin and gold are really uncorrelated assets. Investors have been complaining that the dollar is falling. DKI thinks that depends on your point of view and your time-frame. The IMF slashed forecasts, but is that typically correlated with falling global growth? We look at whether IMF economists are predictive. We’ve all spent the past month hearing about how tariffs and supply chain issues are terrible for tech companies. However, neither that nor DeepSeek are even slowing AI spending. Finally, in our educational topic, we help you understand bond ratings and whether they’re reliable.
This week, we’ll address the following topics:
- Investors claim Bitcoin is correlated with the NASDAQ. It definitely feels that way at times. But is that feeling supported by evidence?
- Investors claim the dollar is falling? Whether that’s true or not depends on your point of view and how long your time-frame is.
- The IMF slashed forecasts. Does it matter?
- Technology companies have been complaining about supply chain disruption and tariffs, but nothing is slowing AI spending so far.
- Educational topic: Understanding bond ratings.
DKI Intern, Cashen Crowe, continues to excel in his new role and is responsible for much of the research behind this week’s 5 Things. I think he’s going to be ready to start putting together the weekly issue with a lot less help from me.
Ready for a week of correlation news? Let’s dive in:
1) Is Bitcoin Really Correlated with the NASDAQ?:
Over the past few years, investors have claimed that Bitcoin is merely a high-beta proxy for the NASDAQ. That means that when the NASDAQ rises, Bitcoin rises more and when the NASDAQ falls, Bitcoin falls by more. It’s felt like when the market goes “risk on” and allocates funds to risky assets like the high-multiple technology stocks that dominate the NASDAQ Comp., funds also flow into the less deep Bitcoin market sending it even higher. Others have suggested that gold should be negatively correlated, insisting that when the market goes “risk off”, and money flows out of those same high-multiple; stocks, some of those funds will find their way to the safe haven of gold. Those stories seem to make sense, but are they supported by the data?
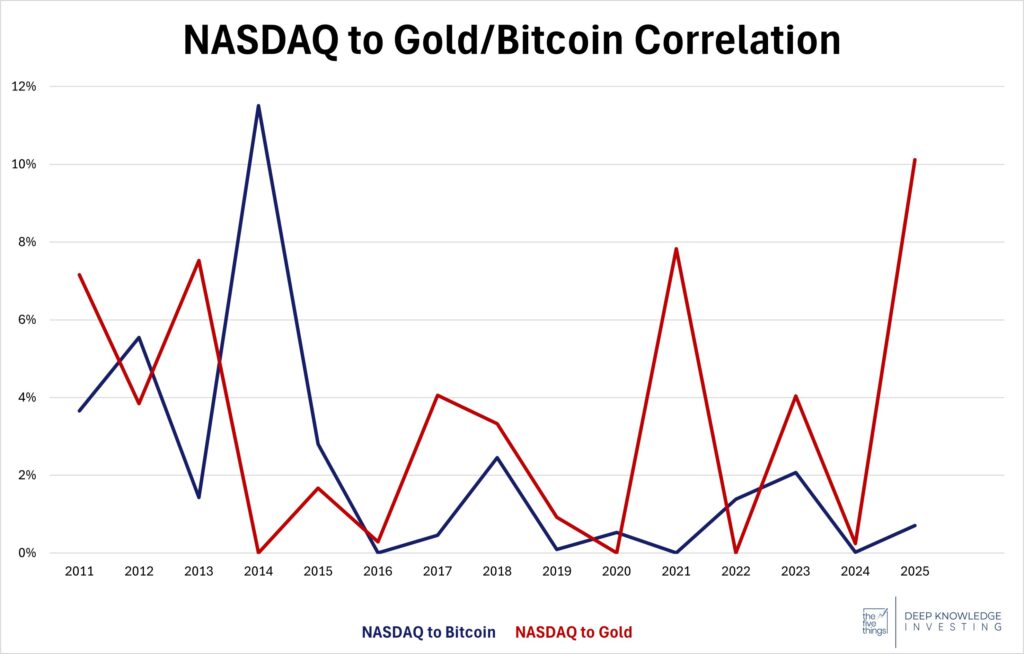
Weekly data correlations max out at under 12%.
DKI Takeaway: I acknowledge I’ve thought these correlations existed so we looked at the data to be sure. Charting weekly prices since the inception of Bitcoin, we have a correlation of 0.0% with the NASDAQ. With the exception of a spike to 11.5% in 2014, yearly correlations are almost all below 4%. That’s a minimal level of correlation. This is true despite the fact that both Bitcoin and NASDAQ stocks benefit from higher worldwide liquidity. We would have thought that gold would be negatively correlated with the NASDAQ. That’s not true either. The 15-year chart shows a correlation of 0.2% with a high of 10.1%. Many people are claiming alternative assets in general, and Bitcoin in particular, do not provide portfolio diversification. The long-term data tells a different story. DKI uses Bitcoin and gold as a way to insure against long-term dollar debasement.
2) The Dollar is Falling – Sort of:
The press is telling us the dollar is falling due to President Trump’s tariff talk. The story goes that by disrupting global trade, he’s reducing confidence in the dollar and making anything connected to international trade less certain and riskier. Whether that’s true or not depends on your point of view. $DXY is the dollar index which compares the strength of the dollar against other major currencies like the euro or yen. That index has fallen to 99 from its January peak of 110. Currencies tend to have small percentage moves so a 10% decline in a few months is significant. Does that mean the critics are correct?
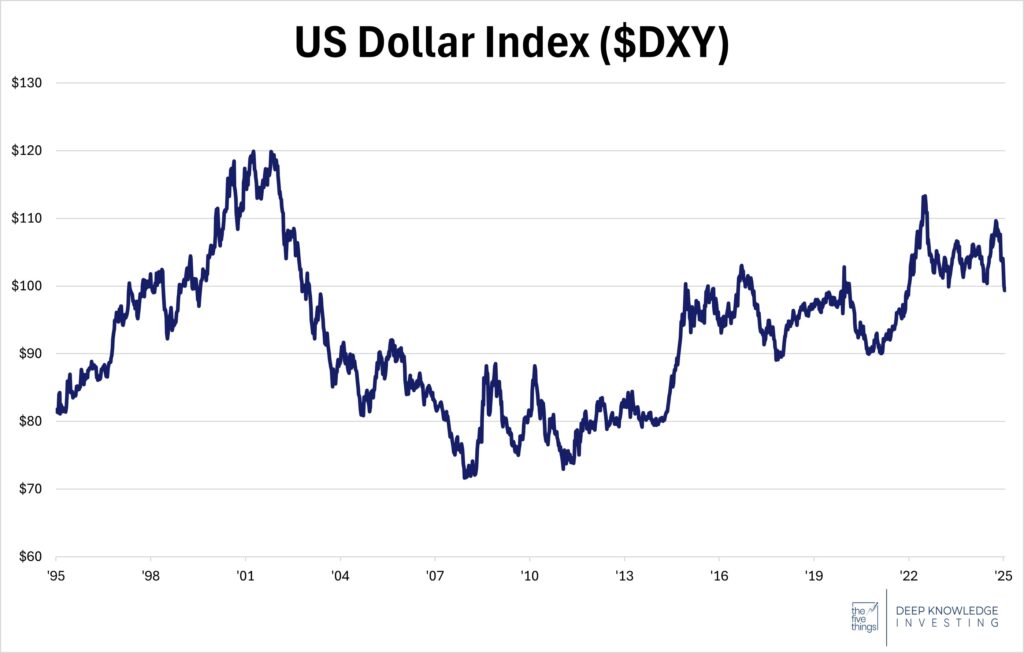
Down recently, but not below historical averages.
DKI Takeaway: The critics aren’t wrong, but we’d recommend taking a longer view. Looking at a long-term chart, $DXY traded at the 99 level in 2022, ’20, ’19, ’17, ’16, ’15, ’03, as well as many other years. During much of the time between 2003 and 2015, $DXY traded well below the 99 level and even below 75. Recent volatility (both up and down) has not been nearly as large compared to historical results as many seem to think. To us, it seems that people get very attached to recent price levels and think that any reduction from recent highs is “wrong” rather than view a recent high as the anomaly.
If the US wants to reduce our trade deficit and make some progress paying off our massive debt, then we’re going to need a weaker dollar (which makes imports more expensive and exports cheaper for our trading partners). We’d also add that most Americans aren’t foreign currency traders and experience a weakening dollar every year measured by its declining purchasing power. The latter is described as inflation.
3) The IMF Slashed Forecasts – Does it Matter?:
The International Monetary Fund (IMF) recently downgraded its global GDP growth forecast for 2025 to 2.8% from the original 3.5% projection. With recent changes in the overall economy largely due to trade tensions, the IMF adjusted growth predictions. DKI has already published our thoughts on President Trump’s tariffs and the effort to reshore American manufacturing. Some used the IMF numbers to highlight the impact of trade disputes on the global economy and the risk of a more pronounced economic slowdown. We were surprised that the reduction in projected growth was only 0.7%. Despite some outliers, the IMF has had success in most of its recent global growth predictions, especially in the last three years.
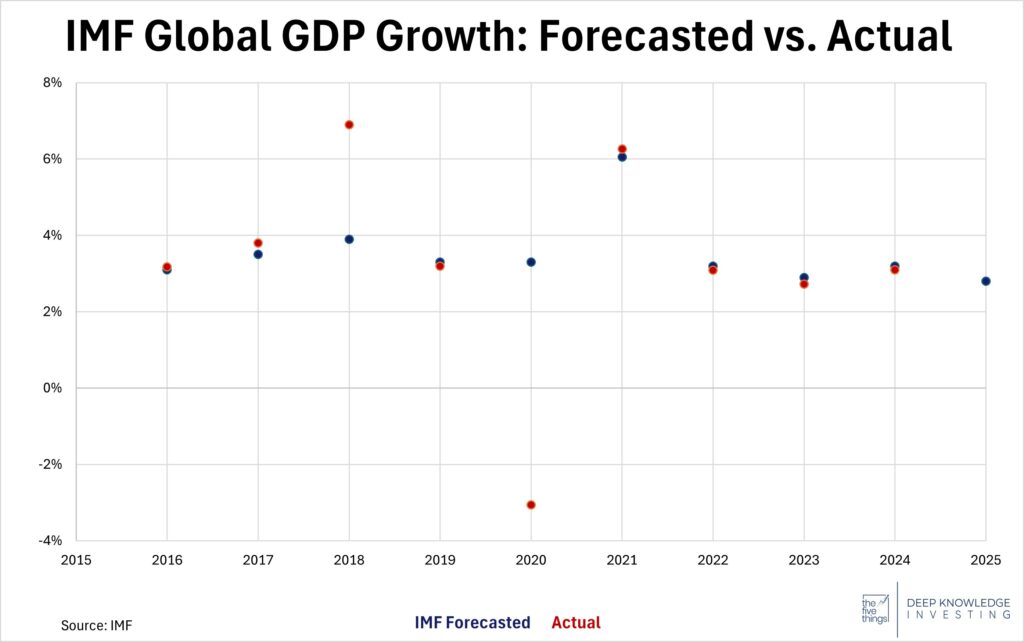
IMF projections have tended to be accurate.
DKI Takeaway: A large factor for this growth prediction relates to US tariffs, which President Trump is using in an effort to reverse years of import dependence. It’s expected that reducing this dependency might hurt growth in the short run. While this prediction is likely to be accurate, it’s going to take some current discomfort to reverse five decades of selling off our manufacturing capacity.
4) Technology Headwinds and AI Spending Resilience:
Macroeconomic pressures are creating headwinds for the technology industry. Slowing growth at Apple and Tesla, and challenges with trade have caused difficulty for the industry. One thing that seems unaffected is AI. AI-related spending and capital expenditures continue to grow, highlighting a stark contrast with the sales of physical product. End customers are already starting to use AI agents to design market plans and to cut costs.
Companies like Amazon, Microsoft, Meta, and Alphabet have planned over $300B in AI spending for 2025. We’ve had months of DeepSeek-related concerns that AI spending would slow, but there’s no evidence of that so far.
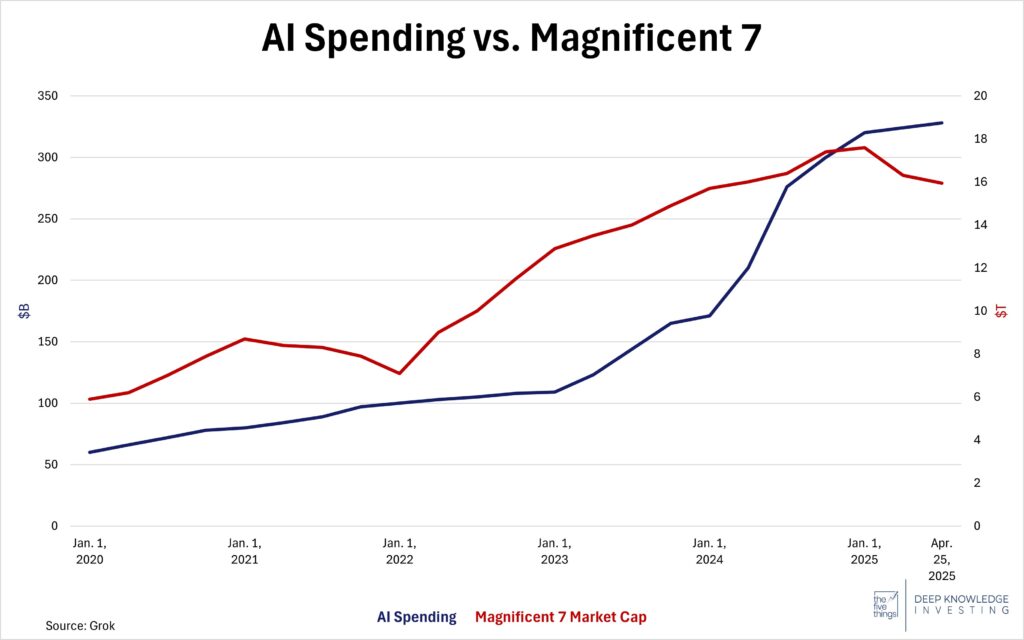
Mag. 7 stock prices rise and fall, but AI spending only grows.
DKI Takeaway: AI growth continues despite reduced device growth, DeepSeek scares, and tariff concerns. AI is already helping some companies save money leaving many wondering if we’ll see higher unemployment, or more productive workers. Given the implications for productivity, national security, cryptography, and allowing FinX stars to make stylized photos of themselves, this trend hasn’t shown any signs of slowing.
5) Educational Topic: Understanding Bond Ratings:
When a company or government issues a bond, that bond is given a rating, which is intended to provide investors an idea of the creditworthiness of the issuer. Three main rating agencies dominate bond evaluations: Moody’s, Standard & Poor’s (S&P), and Fitch Ratings. Analysts will review the bond issuer’s financial situation and assign a rating giving a general assessment of how likely the company is to repay bond holders.
Each agency uses a letter-grade scale to explain the credit evaluation (ranging from AAA-D or Aaa-C), indicating a range of extremely strong credit quality to bond default. However, the ratings fall into two main categories: investment grade or speculative grade (junk bonds). Investment grade is BBB/Baa3 or higher and indicates the issuer has sufficient capacity to repay the investor. Speculative grade, or junk bonds, indicates that the issuer’s credit is less stable and more susceptible to repayment risk.
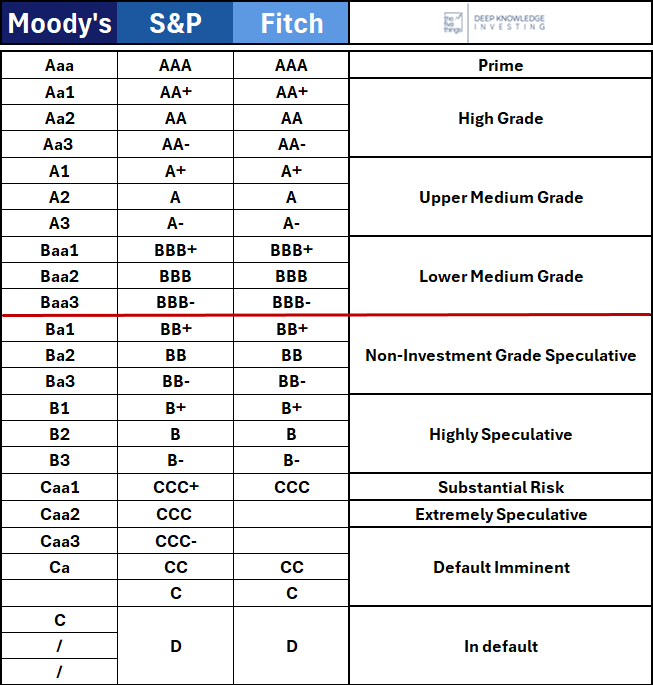
Here are the ratings in order, but don’t forget who pays for the evaluation.
DKI Takeaway: A bond rating is like a credit score for companies. If a bond has a poor rating, or credit score, it means there is a poor history or chance of repayment. Many investors take these ratings into account when making investment decisions. They’ll consider whether the higher yield (or return) on more risky bonds is worth the increased probability of taking a loss. More importantly, we urge investors to remember that it is the companies themselves that pay the bond rating agency. That creates a conflict of interest and incentivizes the ratings agencies to inflate their opinions. That’s part of what helped create losses in the collateralized security collapse during the 2008 financial crisis.
Information contained in this report, and in each of its reports, is believed by Deep Knowledge Investing (“DKI”) to be accurate and/or derived from sources which it believes to be reliable; however, such information is presented without warranty of any kind, whether express or implied. DKI makes no representation as to the completeness, timeliness, accuracy or soundness of the information and opinions contained therein or regarding any results that may be obtained from their use. The information and opinions contained in this report and in each of our reports and all other DKI Services shall not obligate DKI to provide updated or similar information in the future, except to the extent it is required by law to do so.
The information we provide in this and in each of our reports, is publicly available. This report and each of our reports are neither an offer nor a solicitation to buy or sell securities. All expressions of opinion in this and in each of our reports are precisely that. Our opinions are subject to change, which DKI may not convey. DKI, affiliates of DKI or its principal or others associated with DKI may have, taken or sold, or may in the future take or sell positions in securities of companies about which we write, without disclosing any such transactions.
None of the information we provide or the opinions we express, including those in this report, or in any of our reports, are advice of any kind, including, without limitation, advice that investment in a company’s securities is prudent or suitable for any investor. In making any investment decision, each investor should consult with and rely on his or its own investigation, due diligence and the recommendations of investment professionals whom the investor has engaged for that purpose.
In no event shall DKI be liable, based on this or any of its reports, or on any information or opinions DKI expresses or provides for any losses or damages of any kind or nature including, without limitation, costs, liabilities, trading losses, expenses (including, without limitation, attorneys’ fees), direct, indirect, punitive, incidental, special or consequential damages.