Overview:
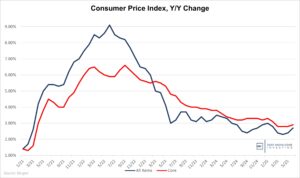
Today, we got the August Consumer Price Index (CPI) report which showed an overall increase of 2.5% for the last year and 0.3% for the month. That’s below last month’s 2.9% and consistent with expectations. The 0.3% monthly increase was above the 0.2% expected, and a bigger increase than last month’s 0.2%. The Core CPI which excludes food and energy was up 3.2% vs last year and up 0.2% from last month. Both of those were consistent with expectations. The annual number is trending towards the Fed’s 2.0% target. Let’s go through the details:

The all-items CPI is down substantially but the sticky Core was unchanged.

Starting to rise to reasonable levels. Now solidly above the 2% mark.
Food:
Food inflation came in at 2.5%, up 0.2% from last month. Food at home was up 2.1% which was 1% above last month. I still think this is understated, but at least the BLS (Bureau of Labor Statistics) is starting to show some small acceleration here. Food away from home is now up 4.0% roughly the same as last couple of months. Anyone who’s seen the recent posts about bills of more than $20 for a burger, fries, and soft drink at fast food places won’t believe this number either. I write this every month, but I continue to be skeptical of this part of the CPI, and have been for the past two years. It seems understated to me (although slightly less than in the past couple of months).
Some people who I respect are saying that food prices really are up a small amount from last year and that consumers are still experiencing sticker shock based on the huge price increases we saw in 2022 and 2023. I acknowledge that may be a possible explanation, but either way, the official numbers show increases of 20% – 30% over just a few years, and many people I talk to are seeing multi-year price increases substantially higher than that. Whether the big move came in 2022, 2023, or is continuing now, both the rate of increase and price levels for food purchases are creating stress in many homes. Simply stated, even if food prices stop rising, the current level is too high for many families.
The reason I keep reprinting the same language about understated food inflation is because the BLS keeps printing the same nonsense.
Energy:
Energy has been an overall tailwind for the CPI following the huge increases in 2022, and is the key reason today’s CPI print wasn’t higher. The August CPI shows energy prices down 4.0% vs last year after fears of a worldwide recession has caused various commodity prices to trade at lower prices. Gasoline was down 10.3% vs last year and fuel oil was down 12.1%. That’s a big change and a lot of volatility compared to the last couple of months.
Right now, there’s an interesting economic and geopolitical dynamic playing out in the energy markets. Concern about slowing large economies and a potential worldwide recession, energy prices have fallen on fears of reduced future demand. That’s could be offset in the future by conflict in Russia and the Middle East, two places that are huge energy producers. As of now, the market is trading like these risks are remote.
Vehicles:
New vehicle pricing was down 1.2% and used vehicle pricing was down 10.4%. These have been volatile categories. We’d also note that the decrease in used car pricing is off of a huge increase. Still, if you look at the chart below, you can see that after the enormous Covid-related run-up in used car prices, recent decreases have retraced more than half of the Covid-related price increases. Pricing is returning towards the “normal” trend.
This month’s CPI report is also at odds with the Manheim Used Vehicle Index which has shown increases in the price of used cars for the past couple of months. I suspect that’s due to a timing delay and that we’ll see higher used car prices in coming CPI reports. Should that be the case, a category that has been a tailwind for CPI disinflation most of this year will start to cause increases again.
In previous versions of this report, we’ve noted the prevalence of $1,000/month auto payments and increasing metrics for credit delinquencies. This week, we saw a warning by Ally Financial that “credit challenges have intensified”. Overall, Americans look like they’re starting to struggle with increasing amounts of debt. Should that trend continue, it would be negative for car prices and make it easier for the Fed to cut rates.

CPI showing lower used car prices. Manheim showing they’re rising.
Services:
Services prices were up 4.9%, consistent with last months and still too high. Services prices have been sticky, and this is an area where the Fed is struggling to bring down inflation. That is partly because much of the increase is caused by higher wages. The labor picture is difficult to analyze right now because the data being provided is inaccurate. Wages are up and the jobs reports show increases in employment along with decreases in available jobs (especially in the private sector). The jobs numbers have been consistently revised downward following positive initial announcements, and there have been multiple huge restatements of this data all showing fewer jobs than originally reported.
All of the new jobs are part-time and almost all job growth is coming from government and health care which is largely funded by government. That’s telling you the public market is throwing money into the economy while private businesses aren’t doing as well. Finally, these figures are constantly revised downwards. We keep seeing positive initial reports while the historical numbers get adjusted by so much that the current month “beat” isn’t enough to show actual growth. Recent employment data has been weaker, but given the inaccuracies and inconsistencies in multiple data sets, and the constant huge revisions, it’s difficult to get a real handle on the labor market. As we’ve said before, there’s been no growth in full-time employment in years. That means the growth in jobs has been people taking on second and third part-time jobs. More people aren’t working. The same people are working more to make ends meet.
Shelter (a fancy word for housing) costs were up 5.2% and represents the largest category of the CPI. Most of today’s CPI increase is due to this category alone. Housing prices have remained strong as people are reluctant to sell their homes and move when higher mortgage rates mean a new smaller home might have higher monthly payments. This has kept supply off the market and prices high. Right now, despite a decreasing CPI, home affordability is terrible for most Americans. That’s even the case with recent decrease in mortgage rates. There is hope that continuing mortgage rate declines will help affordability, but it’s hard to see how that’s going to reduce the price of housing which is what the CPI is supposed to track.

Housing prices remain at all-time highs even with mortgage rates up from three years ago. The recent decline in mortgage rates hasn’t helped.
Analysis:
The all-items CPI is down substantially as the Federal Reserve has done all it can to try to bring inflation under control. I think there are two areas of current and future issues. First, current inflation isn’t due to Federal Reserve policies; but rather, is due to massive overspending in Congress and the White House. This is a bipartisan problem and is not going to change no matter which party wins the November elections. While a recession could cause a brief bout of deflation, the long-term trend is likely to be inflation above the 2% target due to trillions of dollars of excess stimulus coming out of Washington.
Second, even if the CPI went to zero, there’s still the issue that current price levels for necessities like housing, cars, and food are too high for too many families. The current response out of Washington seems to be for more government subsidies and potentially, price controls. The first will lead to MORE inflation as the only way we can pay for more subsidies is to print more dollars. The second will lead to shortages and a black market with much higher prices. The only effective solution would be lowered government spending, something neither party favors.

Washington DC has tried to get people focused on disinflation (a reduction in the rate of inflation). This chart shows why most Americans are experiencing more financial distress.
Conclusion:
More than a month ago, DKI shifted our thinking on Fed rate cuts from “higher for longer” to “sooner rather than later”. The market is debating whether the Fed will cut the fed funds rate by 25bp (.25%) or 50bp (.50%) later this month. We believe we’ll see a 25bp cut this month and that Chairman Powell will say the Fed is prepared to cut further and will remain “data driven” in making those decisions in the coming months.
IR@DeepKnowledgeInvesting.com if you have any questions.
Credit to DKI Intern, Andrew Brown, who contributed to this report.
Information contained in this report is believed by Deep Knowledge Investing (“DKI”) to be accurate and/or derived from sources which it believes to be reliable; however, such information is presented without warranty of any kind, whether express or implied and DKI makes no representation as to the completeness, timeliness or accuracy of the information contained therein or with regard to the results to be obtained from its use. The provision of the information contained in the Services shall not be deemed to obligate DKI to provide updated or similar information in the future except to the extent it may be required to do so.
The information we provide is publicly available; our reports are neither an offer nor a solicitation to buy or sell securities. All expressions of opinion are precisely that and are subject to change. DKI, affiliates of DKI or its principal or others associated with DKI may have, take or sell positions in securities of companies about which we write.
Our opinions are not advice that investment in a company’s securities is suitable for any particular investor. Each investor should consult with and rely on his or its own investigation, due diligence and the recommendations of investment professionals whom the investor has engaged for that purpose.
In no event shall DKI be liable for any costs, liabilities, losses, expenses (including, but not limited to, attorneys’ fees), damages of any kind, including direct, indirect, punitive, incidental, special or consequential damages, or for any trading losses arising from or attributable to the use of this report.


